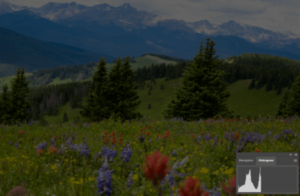
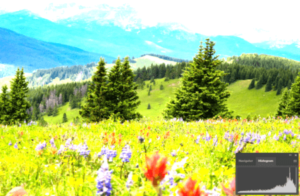
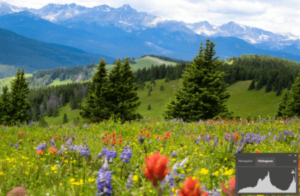
Most digital cameras in the modern day come with a histogram feature. Histograms in photography are in many cases overlooked especially by beginners as well as intermediate photographers. I totally understand because by the first look of a histogram, it seems hard to understand.
In this article, we will guide you through photography histograms and how you can make use of this camera feature to improve your image quality.
What Is A Histogram In Photography?
In photography, a histogram is a graphical representation of the tonal range in an image that determine it’s brightness.
A histogram is read both vertically and horizontally to understand the exposure in a picture.
Reading the histogram horizontally, the left side represents the darkest parts of an image, the middle section shows the midtones while the right side represents the brightest tones. The vertical axis of a histogram shows the concentration of tones in each section.
What Are The Type Of Photography Histograms?
There are three types of histograms that are used in photography; the RGB histogram, Color histogram and luminance histogram.
The RGB histogram is not very common in digital cameras but can be viewed during the editing process. For starters, RGB is an abbreviation for red, green and blue. These are the basic colours emitted by a screen. The intensity of each of these colours determine the colour that the brain interprets.
The camera should be set to record photos in RAW format if you intend to use the RGB histogram. From there, the RGB values can be adjusted in the editing software to add the colour’s brightness level or the intensity of the pixels in each basic colour. This in turn will affect the overall exposure of the image.
While the RGB histogram in photography shows the three basic colors separately, the colors histogram combine them to form one graph. The color histogram shows the intensity of various colors present in a photo. This type of histogram even the points at which RGB colors overlap forming a different colour. Most photographers will not tell the difference between the RGB and the color histograms until post production using editing software such as Lightroom.
The third type of histograms is the luminance histogram. Luminance histogram is a bar graph that shows the brightness levels and their values in a picture. This is the most common histogram in digital cameras and can be accessed by pressing the info button several times. The luminous histogram is more popular among photographers as it is more accurate in describing the brightness distribution in an image.
The Relationship Between Histograms And Exposure
At this point you are already aware that a photography histogram represents the frequency of tones in a picture. There is always a misconception that a perfect image histogram should have most of the bars in the middle forming a mountain like graph. Well, that could be true especially if you are shooting in a daylight where almost everything is evenly bright. However, a good photographer should be able to evaluate whether the picture is perfectly exposed even when the graph shifts to either side of a histogram.
Let us see how we can use the histogram to determine when a picture is underexposed, overexposed or correctly exposed.
Underexposure
 In an underexposed picture, the bars will shift towards the left side of a histogram. This basically means that most of the pixels recorded by the camera sensor are dark with minimal midtones and highlights. This should not be a major concern to you if there are no bars at the furthest end of the histogram and you are shooting RAW files. When the bars of a histogram hit the far end of dark tones otherwise known as shadow clipping, there is no way you can recover the details even in post production.
Overexposure

The opposite of an underexposed picture is an overexposed one. In this case, the bars in a histogram move toward the whites. This will indicate that most of the parts of an image are too bright. Overexposure means that there are minimal shadow details recorded by the camera sensor. An overexposed image is at risk of highlight clipping if the histogram moves to the far right. When there is highlight clipping, an image is completely blown out and there is no way to recover the details.
The Proper Exposure

The proper exposure in photography is the one which is neither overexposed nor underexposed. The image should have the right amount of blacks, shadows, midtones, highlights and whites making it look as real as possible.
You might think a proper histogram should have a bell shape. In this photography histogram there is a high concentration of midtones and lower levels of highlights and shadows. This makes the picture well balanced but recording something different doesn’t mean you are wrong.
Far from it, there are instances when your camera will show a high contrast or low contrast image. It all depends on the scene.
For instance, when you take a photo at night and there is a street light in the frame, you will have a high concentration of dark tones and highlights as well. This will form a “U” shaped high contrast histogram.
This video by ZY Cheng explaining histograms in photography may help what we have discussed sink;
Conclusion On Histograms In Photography
It is good that you understand how to read the histograms in photography at this point. Now you can instantly tell when you are taking the correct picture as you know what to expect depending on the scene. All that is remaining is to put into practice what you have learnt to sharpen your photography skills. Remember photography like any other art gets better as you keep practicing.

